
Technological progress is often seen as the engine of economic growth, but measuring it accurately can be a challenge. One effective way to measure technological progress is through the use of economic proxies like Total Factor Productivity (TFP), offering insights into the efficiency of input-output translation. Keep reading on pioneer-technology.com to learn more about this topic, we help you dissect the metrics, understand the nuances, and reveal the true drivers of technological advancement, ensuring you stay ahead in the ever-evolving tech landscape. Delve deeper into productivity metrics, economic indicators, and innovation measurements.
1. Understanding the Technological Slowdown: Is There Really One?
Is technological progress really slowing down? The question is complex, and the answer isn’t straightforward. While some indicators might suggest a slowdown, a deeper dive reveals a more nuanced picture.
The Puzzle of Slower GDP Growth
Dietrich Vollrath’s book, “Fully Grown: Why a Stagnant Economy is a Sign of Success,” delves into the apparent slowdown of GDP per capita growth in the US. While the latter half of the 20th century saw an average growth of 2.25%, the first two decades of the 21st century only managed 1.00%. This isn’t solely attributable to the Great Recession; the weaker growth was evident both before and after the economic downturn.
The Technological Stagnation Hypothesis
One popular explanation for this slowdown is technological stagnation. The argument goes that advancements in digital technology haven’t been sufficient to compensate for the stagnation in the physical world. We’re seeing innovation in the digital realm (“bits”) but not in tangible goods and infrastructure (“atoms”). As the saying goes, “We wanted flying cars and got 140 characters.”
The Difficulty of Measuring Technology
The main problem with the technological stagnation hypothesis is the difficulty in testing it. Even when focusing on a single industry, defining and measuring technological progress proves challenging. Consider air travel: is the lack of significant increase in speed a sign of stagnation? Or do improvements in fuel efficiency, noise reduction, and safety represent progress? Similarly, in agriculture, do we focus on crop yields, resilience, or reduced input usage? As Matt Clancy pointed out in a Twitter thread, even measuring the impact of genetic engineering on corn is surprisingly complex.
 Corn genetic modification measuring the impact
When considering “technology” as a whole, the challenge becomes even greater. How do you create a comprehensive index that encompasses advancements in diverse fields like aviation and agriculture? One approach is to use economic proxies.
Economic Proxies for Technology: GDP and TFP
The most basic measure is GDP per capita. The logic is simple: better technology leads to increased economic output, all else being equal. However, GDP per capita is influenced by factors beyond technology, such as capital investment and education levels.
A more refined measure is Total Factor Productivity (TFP). TFP attempts to quantify the “extra” GDP generated after accounting for inputs like capital and labor. It represents the efficiency with which inputs are translated into outputs, making it a common proxy for overall technology.
The Imperfections of Economic Proxies
While GDP per capita and TFP are widely used, it’s crucial to acknowledge their limitations. As Vollrath highlights, these measures are imperfect proxies for technological change. It’s possible that technological progress hasn’t slowed down at all, and that the observed slowdown in real GDP per capita and TFP growth is driven by non-technological factors.
2. What Factors are Causing the Slowdown?
If technological stagnation isn’t the sole culprit, what factors are contributing to the slowdown in GDP per capita growth? Vollrath’s analysis points to several key drivers.
Vollrath’s Decomposition of the Slowdown
Vollrath attributes the 1.25% annual slowdown in real GDP per capita growth to the following factors:
| Factor | Impact (percentage points) |
|---|---|
| Declining growth in human capital | 0.80 |
| Shift to service spending | 0.20 |
| Declining worker reallocation | 0.15 |
| Declining geographic mobility | 0.10 |
The most striking observation is that changes in human capital account for two-thirds of the slowdown. This decline stems from factors like an aging workforce, fewer workers per capita, reduced work hours, and plateauing educational attainment. The decline in the number of workers per capita, a consequence of choices made by affluent societies to have fewer children, plays a significant role.
The Limited Role of TFP
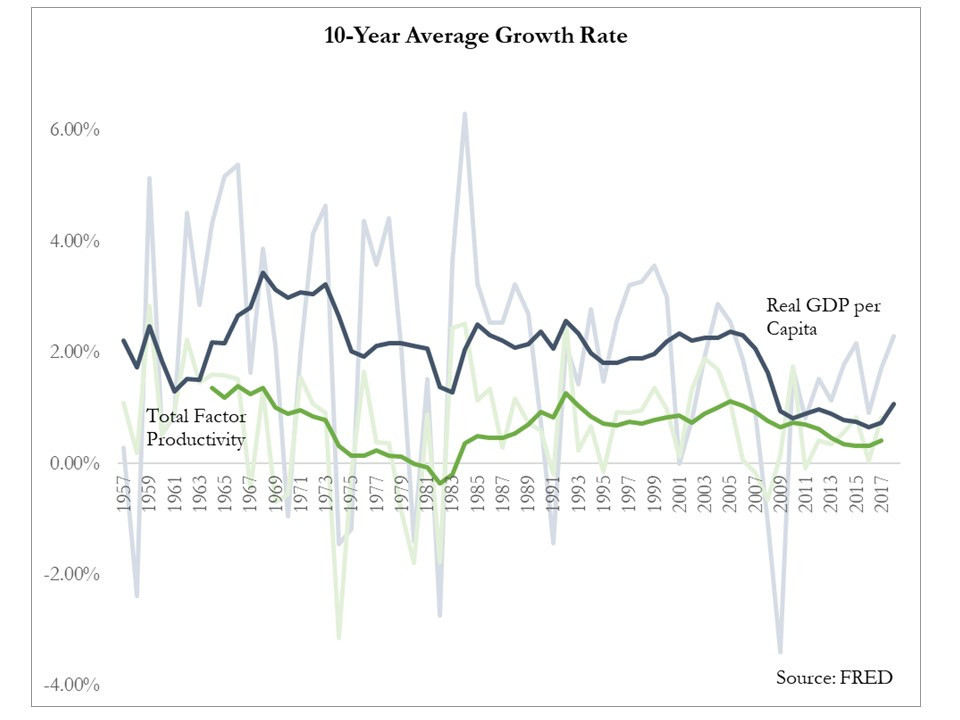
This leaves only about 0.45 percentage points for explanations related to capital stock and TFP. As the graph shows, GDP per capita growth experiences a noticeable drop in 2007, while TFP growth only declines slightly. Vollrath argues that a slowdown in technological progress accounts for, at most, one-third of the overall growth slowdown.
Moreover, Vollrath contends that the decline in TFP growth likely has non-technological explanations.
3. How Shifting Preferences Affect Technological Progress Measurement
The way we spend our money significantly impacts how we measure technological progress. A shift in spending from goods to services, for example, can skew the overall picture.
The Sectoral Composition of TFP Growth
Economy-wide TFP growth is calculated as a weighted average of TFP growth across different sectors. These weights are determined by spending shares. If 60% of our income is spent on goods and 40% on services, then economy-wide TFP growth is 60% of the TFP growth in goods and 40% of the TFP growth in services.
However, these spending shares change over time. It’s possible that TFP growth within each sector remains constant, but a shift in spending towards sectors with slower TFP growth can pull down the overall measure of economy-wide TFP growth, even if no individual sector is slowing down.
The Goods vs. Services Dynamic
While various sectors have experienced slowdowns in TFP growth, a significant portion of the overall TFP slowdown can be attributed to the shift in spending from goods to services. TFP growth in the goods sector is typically faster than in the services sector. Therefore, increasing the weight of the services sector’s TFP growth lowers the overall economy-wide TFP growth.
The Nature of Services and Attention
Why is TFP growth in services generally slower? TFP measures the extra output gained from a given set of inputs (labor and capital). In the goods sector, the focus is on the output itself (a TV, an iPhone, a coat). The specific inputs used are less important.
However, many services involve the purchase of attention from someone. Think of childcare workers, doctors, and restaurant servers. When you’re paying for someone’s attention, improving TFP becomes challenging. It would require extracting more minutes of attention from the same number of workers. Given the fixed 24 hours in a day, it’s difficult to see where this extra attention can come from.
4. Other Factors Contributing to the TFP Slowdown
Beyond human capital and the shift to services, other factors contribute to the TFP slowdown. These include reduced entry and exit of firms and decreased job changes.
The Role of Firm and Job Turnover
More productive firms tend to replace less productive ones, and workers tend to move to higher-paying (and therefore, more productive) jobs. When firm and job turnover slows down, it can negatively impact TFP growth.
The slowdown in the entry of higher-productivity firms might be a manifestation of a technological slowdown. Perhaps a decrease in cost-reducing and quality-enhancing innovations is reducing the supply of new business models. However, other explanations are possible. Lax antitrust policies could lead to increased market power, or the slowdown in firm entry could be a consequence of declining birth rates in the 1970s, as argued in this NBER paper.
The Decline in Geographic Mobility
The decline in geographic mobility also has both concerning and benign potential causes. Workers may be unable to move to higher-productivity regions due to rising housing costs, potentially caused by restrictive housing supply policies in major cities, as discussed in this AEA article. Alternatively, it could be that people simply prefer not to move, and the high mobility rates of the late 20th century were an anomaly, as suggested in this SSRN paper.
5. How Technological Progress Can Be Measured Using Patents
One of the ways to measure technological progress accurately is with the help of patents.
What are Patents
Patents represent a crucial metric for assessing technological progress because they provide a tangible record of inventive activity. A patent is an exclusive right granted for an invention, which allows the patent holder to exclude others from making, using, or selling the invention for a limited period, generally twenty years. This system encourages innovation by protecting the inventor’s rights and providing an incentive for further research and development.
How Patents Show Technological Progress
The number of patents filed and granted can indicate the level of innovative activity in a particular region or industry. An increase in patent filings suggests that more inventions are being developed and protected, which can be interpreted as a sign of technological advancement.
Evaluating Patent Quality
Not all patents are created equal. Some patents represent significant breakthroughs, while others are incremental improvements. Evaluating the quality of patents involves looking at factors such as:
- Citation Analysis: How often a patent is cited by subsequent patents can indicate its impact and importance. Highly cited patents are often considered more influential.
- Scope of Claims: The breadth of the claims made in a patent can indicate its potential impact. Broader claims may cover more applications and therefore be more valuable.
- Commercial Success: Whether a patented invention is successfully commercialized can be a measure of its practical value and impact on the market.
Patent Statistics and Trends
Analyzing patent statistics over time can reveal trends in technological development. For example, a surge in patents related to artificial intelligence or biotechnology can indicate rapid advancements in these fields. Patent data can also be used to compare the innovative performance of different countries or regions, helping to identify leaders and emerging hubs of technological innovation.
Patent Limitations
While patents can provide valuable insights into technological progress, they have limitations. For example:
- Strategic Patenting: Companies may file patents for defensive purposes or to create patent thickets, which can stifle innovation.
- Patent Quality Issues: Some patents may be of questionable validity or may not represent significant advancements.
- Innovation Hidden: Not all inventions are patented. Some companies choose to keep their inventions as trade secrets, which are not reflected in patent statistics.
6. Role of Research and Development (R&D) Expenditure in Measuring Technological Progress
Another method for measuring technological advancement effectively is by closely observing the investment in Research and Development (R&D).
Tracking the R&D spending
R&D expenditure is a direct measure of the resources allocated towards creating new technologies and improving existing ones. It includes spending by governments, businesses, and academic institutions on basic research, applied research, and experimental development. Tracking R&D expenditure provides insights into the level of commitment to innovation and technological advancement in a particular region or industry.
Linking Expenditure to Innovation
Increased R&D spending is often associated with higher levels of innovation. Companies and countries that invest heavily in R&D tend to produce more patents, develop more new products and services, and achieve higher levels of economic growth. However, the relationship between R&D spending and innovation is not always linear, as the effectiveness of R&D investments can vary depending on factors such as the quality of research, the efficiency of R&D management, and the broader innovation ecosystem.
Different Types of R&D
- Basic Research: This involves theoretical or experimental work undertaken primarily to acquire new knowledge without any specific application in view.
- Applied Research: This involves original investigation undertaken to acquire new knowledge but directed towards a specific practical aim or objective.
- Experimental Development: This involves systematic work, drawing on knowledge gained from research and practical experience, that is directed to producing new products or processes or to improving existing products or processes.
R&D Intensity
R&D intensity, defined as R&D expenditure as a percentage of GDP or revenue, is a useful metric for comparing R&D investments across different countries or industries. Higher R&D intensity indicates a greater commitment to innovation and technological advancement. Countries with high R&D intensity, such as South Korea and Israel, tend to be leaders in technological innovation.
The Limitations of R&D Expenditure
- Input Measure: R&D expenditure is an input measure and does not guarantee innovation.
- Time Lag: There can be a significant time lag between R&D spending and the realization of innovation.
- Focus: R&D expenditure may not capture informal or grassroots innovation.
7. How Measuring Productivity Growth Help Determine Technological Progress
Another one of the ways to measure technological progress accurately is with the help of productivity growth.
The Definition of Productivity Growth
Productivity growth refers to the increase in output per unit of input, typically measured as output per labor hour or output per unit of capital. It reflects how efficiently resources are being used to produce goods and services. Higher productivity growth indicates that more output is being generated from the same amount of input, which is a key driver of economic growth and improved living standards.
The Link Between Technology and Productivity
Technological progress is a primary driver of productivity growth. New technologies enable workers to produce more goods and services in less time, reduce production costs, and improve product quality. For example, the introduction of automation in manufacturing has significantly increased productivity by reducing the need for manual labor and improving production efficiency. Similarly, the development of new crop varieties has increased agricultural productivity by increasing yields and reducing the need for inputs such as water and fertilizers.
Ways to measure productivity growth
- Labor Productivity: This is the most common measure of productivity growth, calculated as output per labor hour. It reflects the efficiency with which labor is being used to produce goods and services.
- Capital Productivity: This measures the output per unit of capital, such as machinery, equipment, and buildings. It reflects the efficiency with which capital is being used in production.
- Total Factor Productivity (TFP): This measures the portion of output growth that cannot be explained by the accumulation of labor and capital inputs. It reflects the efficiency with which all inputs are being used in production and is often used as a proxy for technological progress.
Multi-factor Productivity
Multi-factor productivity (MFP) enhances total factor productivity (TFP) by incorporating a broader range of inputs beyond just labor and capital, such as energy, materials, and purchased services. This provides a more comprehensive view of how efficiently an organization transforms all its inputs into outputs. By accounting for these additional factors, MFP offers a more nuanced and accurate assessment of productivity improvements, highlighting the impact of technological advancements and process optimizations across various operational dimensions.
What are the Limitations to productivity growth?
- Measurement Issues: It can be challenging to accurately measure output and inputs, especially in industries with complex products and services.
- External Factors: Productivity growth can be affected by external factors such as economic conditions, government policies, and social trends.
- Focus on Efficiency: Productivity growth focuses on efficiency but may not capture other important aspects of technological progress, such as improvements in product quality or environmental sustainability.
8. The role of Education and Human Capital Indexes in determining technological progress
Education and human capital indexes are vital in measuring technological progress by quantifying the skills, knowledge, and health of a population, which directly influence its capacity to innovate and adopt new technologies. These indexes assess various factors such as educational attainment, quality of education, and health indicators to provide a comprehensive measure of human capital. A well-educated and healthy population is more likely to contribute to technological advancements, drive economic growth, and adapt to changing technological landscapes.
The Human Capital and Technologies
Education equips individuals with the foundational knowledge and skills necessary to understand and contribute to technological innovation. A strong educational system fosters critical thinking, problem-solving abilities, and creativity, which are essential for generating new ideas and developing new technologies. Moreover, education enables individuals to effectively use and adapt existing technologies, thereby increasing productivity and efficiency across various sectors.
The Basic Index of Human Capital
- Educational Attainment: Measures the average level of education achieved by a population, such as years of schooling or completion rates at different educational levels.
- Quality of Education: Assesses the quality of educational systems, including factors such as teacher qualifications, student-teacher ratios, and learning outcomes.
- Health Indicators: Includes measures of population health, such as life expectancy, infant mortality rates, and disease prevalence, which can impact workforce productivity and innovation capacity.
The effect of skilled workers in technology
Countries and regions with high levels of human capital tend to be more innovative and technologically advanced. For example, countries with strong educational systems and high levels of investment in research and development, such as the United States and South Korea, are leaders in technological innovation. Similarly, regions with a highly skilled workforce, such as Silicon Valley, tend to attract technology companies and drive technological progress.
Limitations to human capital indexes
- Measurement Issues: It can be challenging to accurately measure human capital, especially in developing countries where data may be limited or unreliable.
- Time Lag: There can be a significant time lag between investments in education and health and the realization of economic benefits.
- Focus on Quantity: Human capital indexes may focus on the quantity of education and health but may not fully capture the quality of these investments.
9. How to measure Technological Readiness and Adoption Rates accurately
To accurately measure technological readiness and adoption rates, various methods are employed to assess how well a society or organization is prepared to integrate and utilize new technologies. Technological readiness evaluates the infrastructure, skills, and policies necessary to support technological advancements. Adoption rates, on the other hand, measure how quickly and widely new technologies are being used within a population or industry.
Ways to measure Technological Readiness
- Infrastructure Assessment: Evaluate the availability and quality of critical infrastructure, such as internet access, telecommunications networks, and electricity supply.
- Skills Assessment: Measure the level of digital literacy and technical skills within the population or workforce, including the ability to use computers, software, and other digital tools.
- Policy Assessment: Assess the extent to which government policies and regulations support technological innovation and adoption, including policies related to intellectual property, data privacy, and cybersecurity.
Measuring Adoption Rates
- Diffusion of Innovation Theory: This theory explains how new technologies are adopted over time, categorizing adopters into groups such as innovators, early adopters, early majority, late majority, and laggards.
- Surveys and Questionnaires: Conduct surveys to gather data on technology usage, attitudes, and barriers to adoption.
- Data Analytics: Use data analytics techniques to track technology usage patterns, such as website traffic, mobile app downloads, and social media engagement.
The Connection of Technology and Economy
Countries and regions with high levels of technological readiness and adoption rates tend to be more competitive and economically successful. For example, countries with widespread internet access and a digitally skilled workforce are better positioned to attract technology companies, foster innovation, and drive economic growth. Similarly, organizations that are quick to adopt new technologies tend to be more efficient, productive, and competitive.
The Limitations to technology measurements
- Data Availability: It can be challenging to obtain accurate and reliable data on technological readiness and adoption rates, especially in developing countries.
- Causation vs. Correlation: It can be difficult to establish a causal relationship between technological readiness, adoption rates, and economic outcomes.
- Context Specificity: Technological readiness and adoption rates can vary significantly across different contexts, such as industries, regions, and demographic groups.
10. What are the Ways to Measure the Impact of Technological Progress on Society
Measuring the impact of technological progress on society involves assessing the wide-ranging effects of new technologies on various aspects of human life, including economic, social, cultural, and environmental dimensions. This requires a multi-faceted approach that considers both the positive and negative consequences of technological advancements.
Different indexes
- Economic Indicators: Track key economic indicators such as GDP growth, employment rates, productivity gains, and income inequality to assess the economic impact of technological progress.
- Social Indicators: Measure social outcomes such as education levels, health outcomes, crime rates, and social cohesion to assess the social impact of technological progress.
- Cultural Indicators: Assess the impact of technological progress on cultural values, beliefs, and practices, including the preservation of cultural heritage and the promotion of cultural diversity.
- Environmental Indicators: Monitor environmental outcomes such as greenhouse gas emissions, pollution levels, and resource depletion to assess the environmental impact of technological progress.
Assessing technology’s effects
- Case Studies: Conduct in-depth case studies of specific technologies or industries to understand their impact on society.
- Surveys and Focus Groups: Gather data on people’s attitudes, perceptions, and experiences with new technologies through surveys and focus groups.
- Data Analytics: Use data analytics techniques to track the diffusion of new technologies, identify patterns of adoption, and assess their impact on various social and economic outcomes.
What does technological Progress do?
Technological progress can have a profound impact on society, leading to improvements in living standards, increased access to information and education, enhanced communication and collaboration, and new opportunities for economic development. However, technological progress can also have negative consequences, such as job displacement, increased inequality, privacy concerns, and environmental degradation.
Limitations of Measuring Impact
- Causation vs. Correlation: It can be challenging to establish a causal relationship between technological progress and specific social, economic, or environmental outcomes.
- Long-Term Effects: The long-term effects of technological progress may not be immediately apparent and can be difficult to predict.
- Subjectivity: Assessing the impact of technological progress often involves subjective judgments and value-based assessments.
Conclusion: The Multifaceted Nature of Technological Progress
Vollrath’s analysis highlights the complexity of measuring technological progress and understanding its impact on economic growth. While technological advancements undoubtedly play a crucial role, non-technological factors like human capital, shifting preferences, and demographic trends also exert significant influence.
Before you go, we recommend you to visit pioneer-technology.com for a more in-depth information about innovative technologies, emerging products, and technological breakthroughs. You can also contact us at Address: 450 Serra Mall, Stanford, CA 94305, United States. Phone: +1 (650) 723-2300. Website: pioneer-technology.com
FAQ: Measuring Technological Progress
How do you define technological progress?
Technological progress refers to the creation, development, and adoption of new technologies, processes, and innovations that improve efficiency, productivity, and overall societal advancement.
What are the main indicators of technological progress?
Key indicators include R&D expenditure, patent filings, productivity growth, educational attainment, technological readiness, and various economic and social indicators.
Why is it important to measure technological progress?
Measuring technological progress helps policymakers, businesses, and researchers understand the rate of innovation, identify areas for improvement, and make informed decisions about investments and policies.
How does R&D expenditure relate to technological progress?
R&D expenditure is a direct measure of the resources allocated towards creating new technologies, and higher R&D spending is often associated with increased innovation and technological advancement.
What is Total Factor Productivity (TFP) and how does it measure technological progress?
TFP measures the portion of output growth that cannot be explained by the accumulation of labor and capital inputs, reflecting the efficiency with which all inputs are being used in production and serving as a proxy for technological progress.
How do patents reflect technological progress?
Patents provide a tangible record of inventive activity, with the number and quality of patents indicating the level of innovative activity in a particular region or industry.
What role do education and human capital play in technological progress?
Education and human capital indexes quantify the skills, knowledge, and health of a population, which directly influence its capacity to innovate, adopt new technologies, and drive economic growth.
How do technological readiness and adoption rates impact society?
Technological readiness and adoption rates assess how well a society is prepared to integrate and utilize new technologies, influencing economic competitiveness, innovation, and overall societal advancement.
What are the limitations of using economic proxies to measure technological progress?
Economic proxies like GDP per capita and TFP can be influenced by non-technological factors, such as human capital, shifting preferences, and demographic trends, making them imperfect measures of technological change.
How can we ensure that technological progress benefits society as a whole?
To ensure that technological progress benefits society, it is essential to consider its wide-ranging effects on economic, social, cultural, and environmental dimensions, addressing potential negative consequences such as job displacement, increased inequality, and environmental degradation.